2.3 Case study
The use of the calendar display is illustrated on smart meter energy usage from four households in Melbourne, Australia. Individuals can download their own data from the energy supplier, and the data used in this section is sourced from four colleagues of the authors. The calendar display is useful to help people understand their energy use. The data contains half-hourly electricity consumption in the first half of 2018. The analysis begins by looking at the distribution over days of week, then time of day split by work days and non-work days, followed by the calendar display to inspect the daily schedules.
Figure 2.11 shows energy consumption against time of day, separately by weekday and weekend. Household 1 is an early riser, starting their day before 6 and going back home around 18 on weekdays. They switch air conditioning on when they get home from work and keep it operating until midnight, evident from the small horizontal cluster of points around 0.8 kWh. On the other hand, the stripes above 1 kWh for household 2 indicates that air conditioning may run continuously for some periods, consuming twice the energy as household 1. A third peak occurs around 15 for household 3 only, likely coinciding when the children arrive home from school. They also have a consistent energy pattern between weekdays and weekends. As for household 4, their home routine starts after 18 on weekdays. Figures 2.11, part of a traditional graphical toolkit, are useful for summarizing overall deviations across days and households.
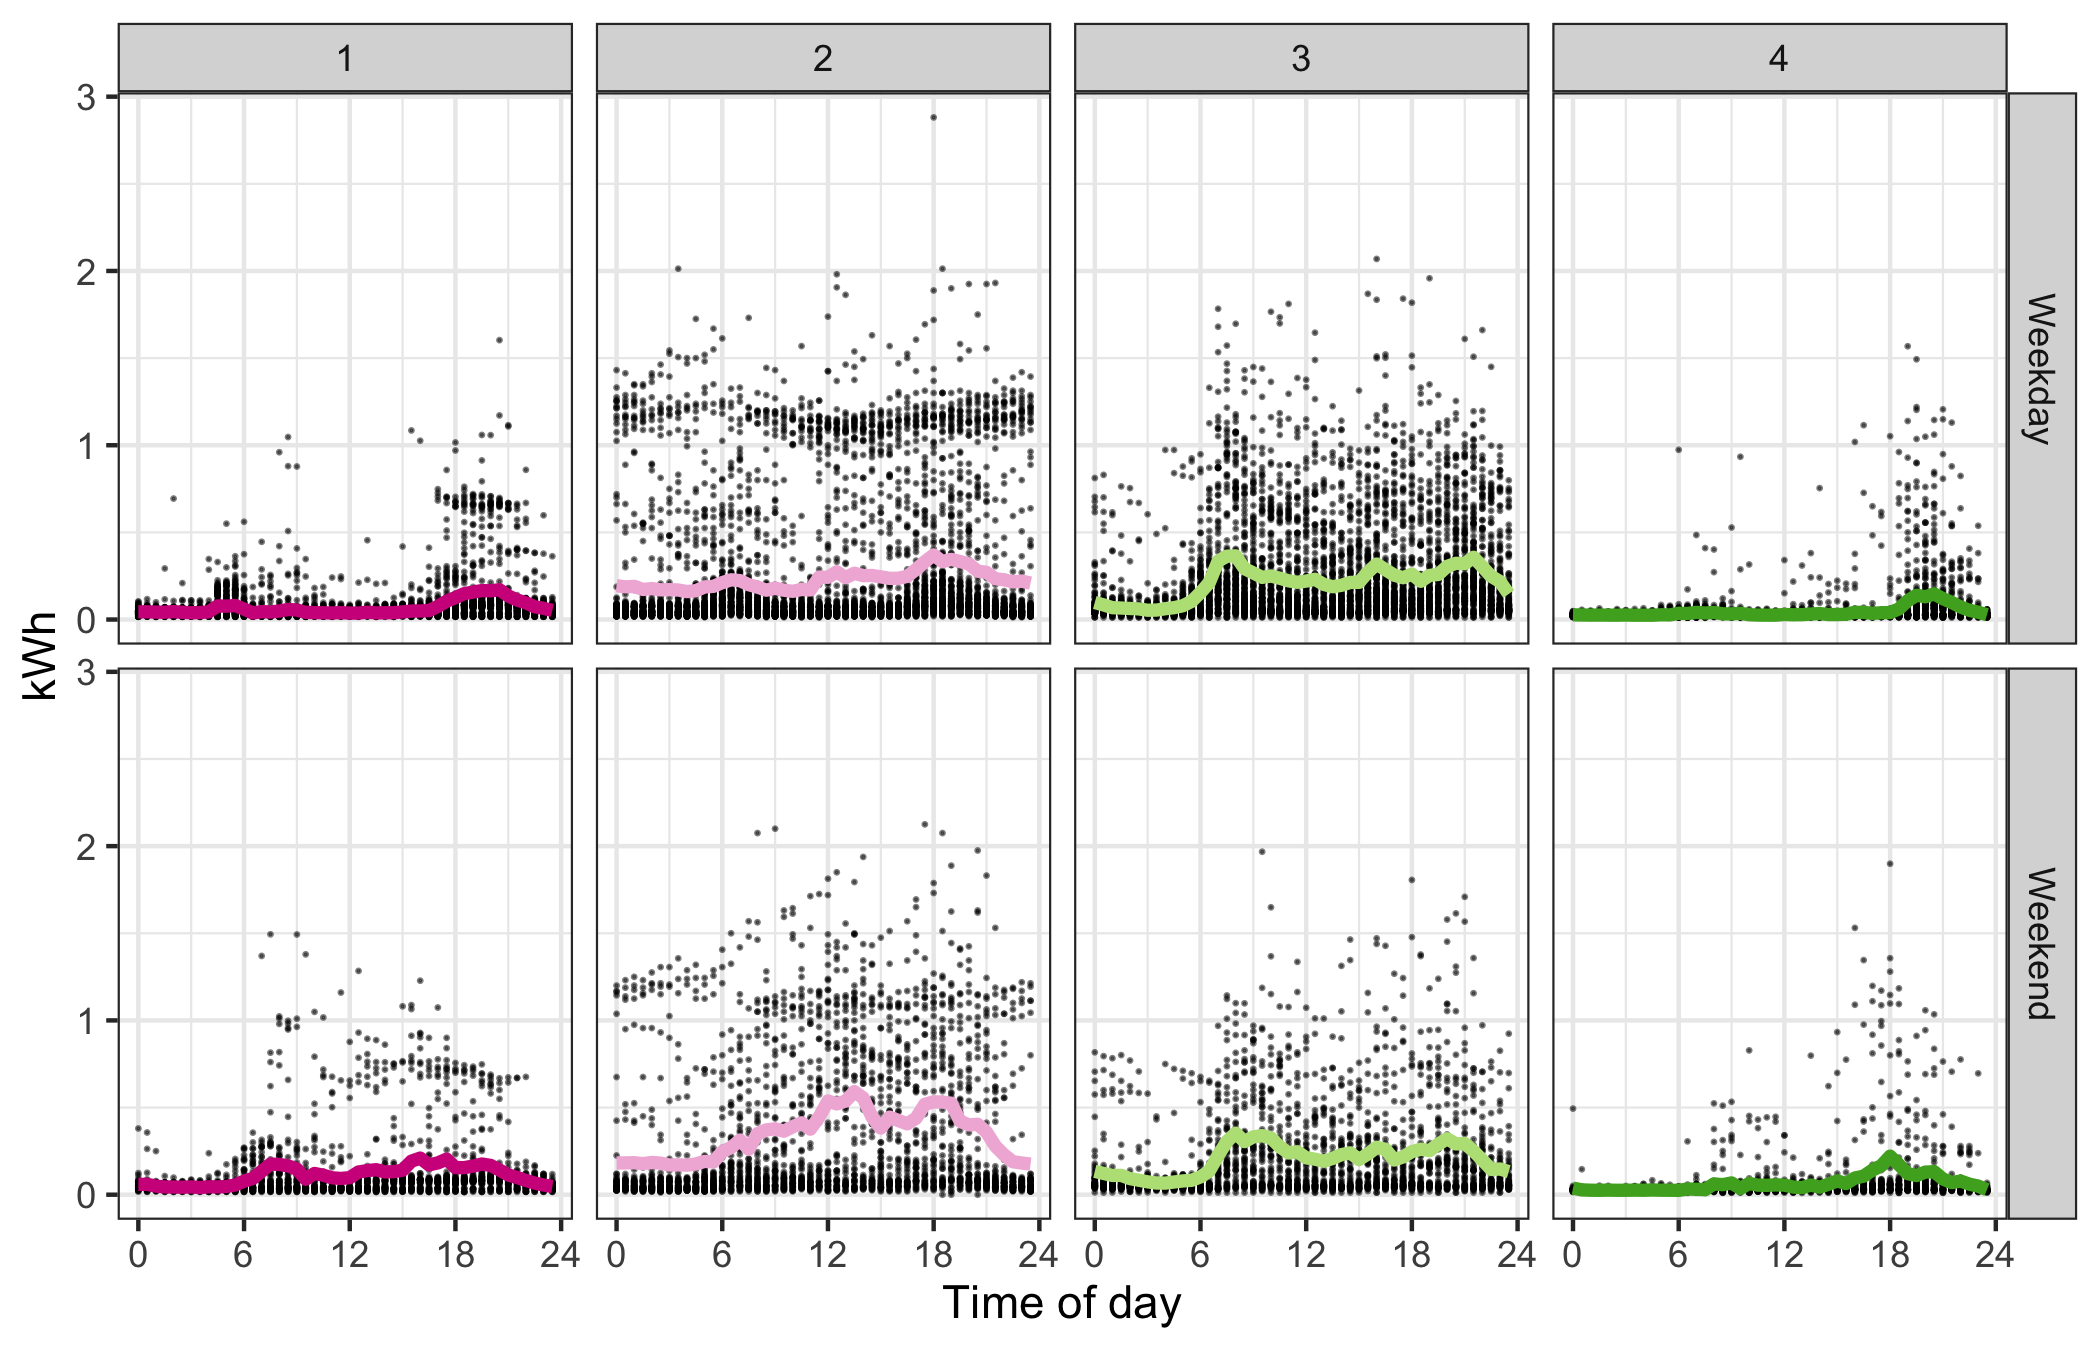
Figure 2.11: Examining sub-daily variability of energy usage by time of day, with hourly averages overlaid, faceted by household and type of day. On weekdays, household 1 wakes up early before 6, and household 2 around 6, followed by household 3 and 4. The use of air conditioning is notable in households 1 and 2, as seen by horizontal clusters of points.
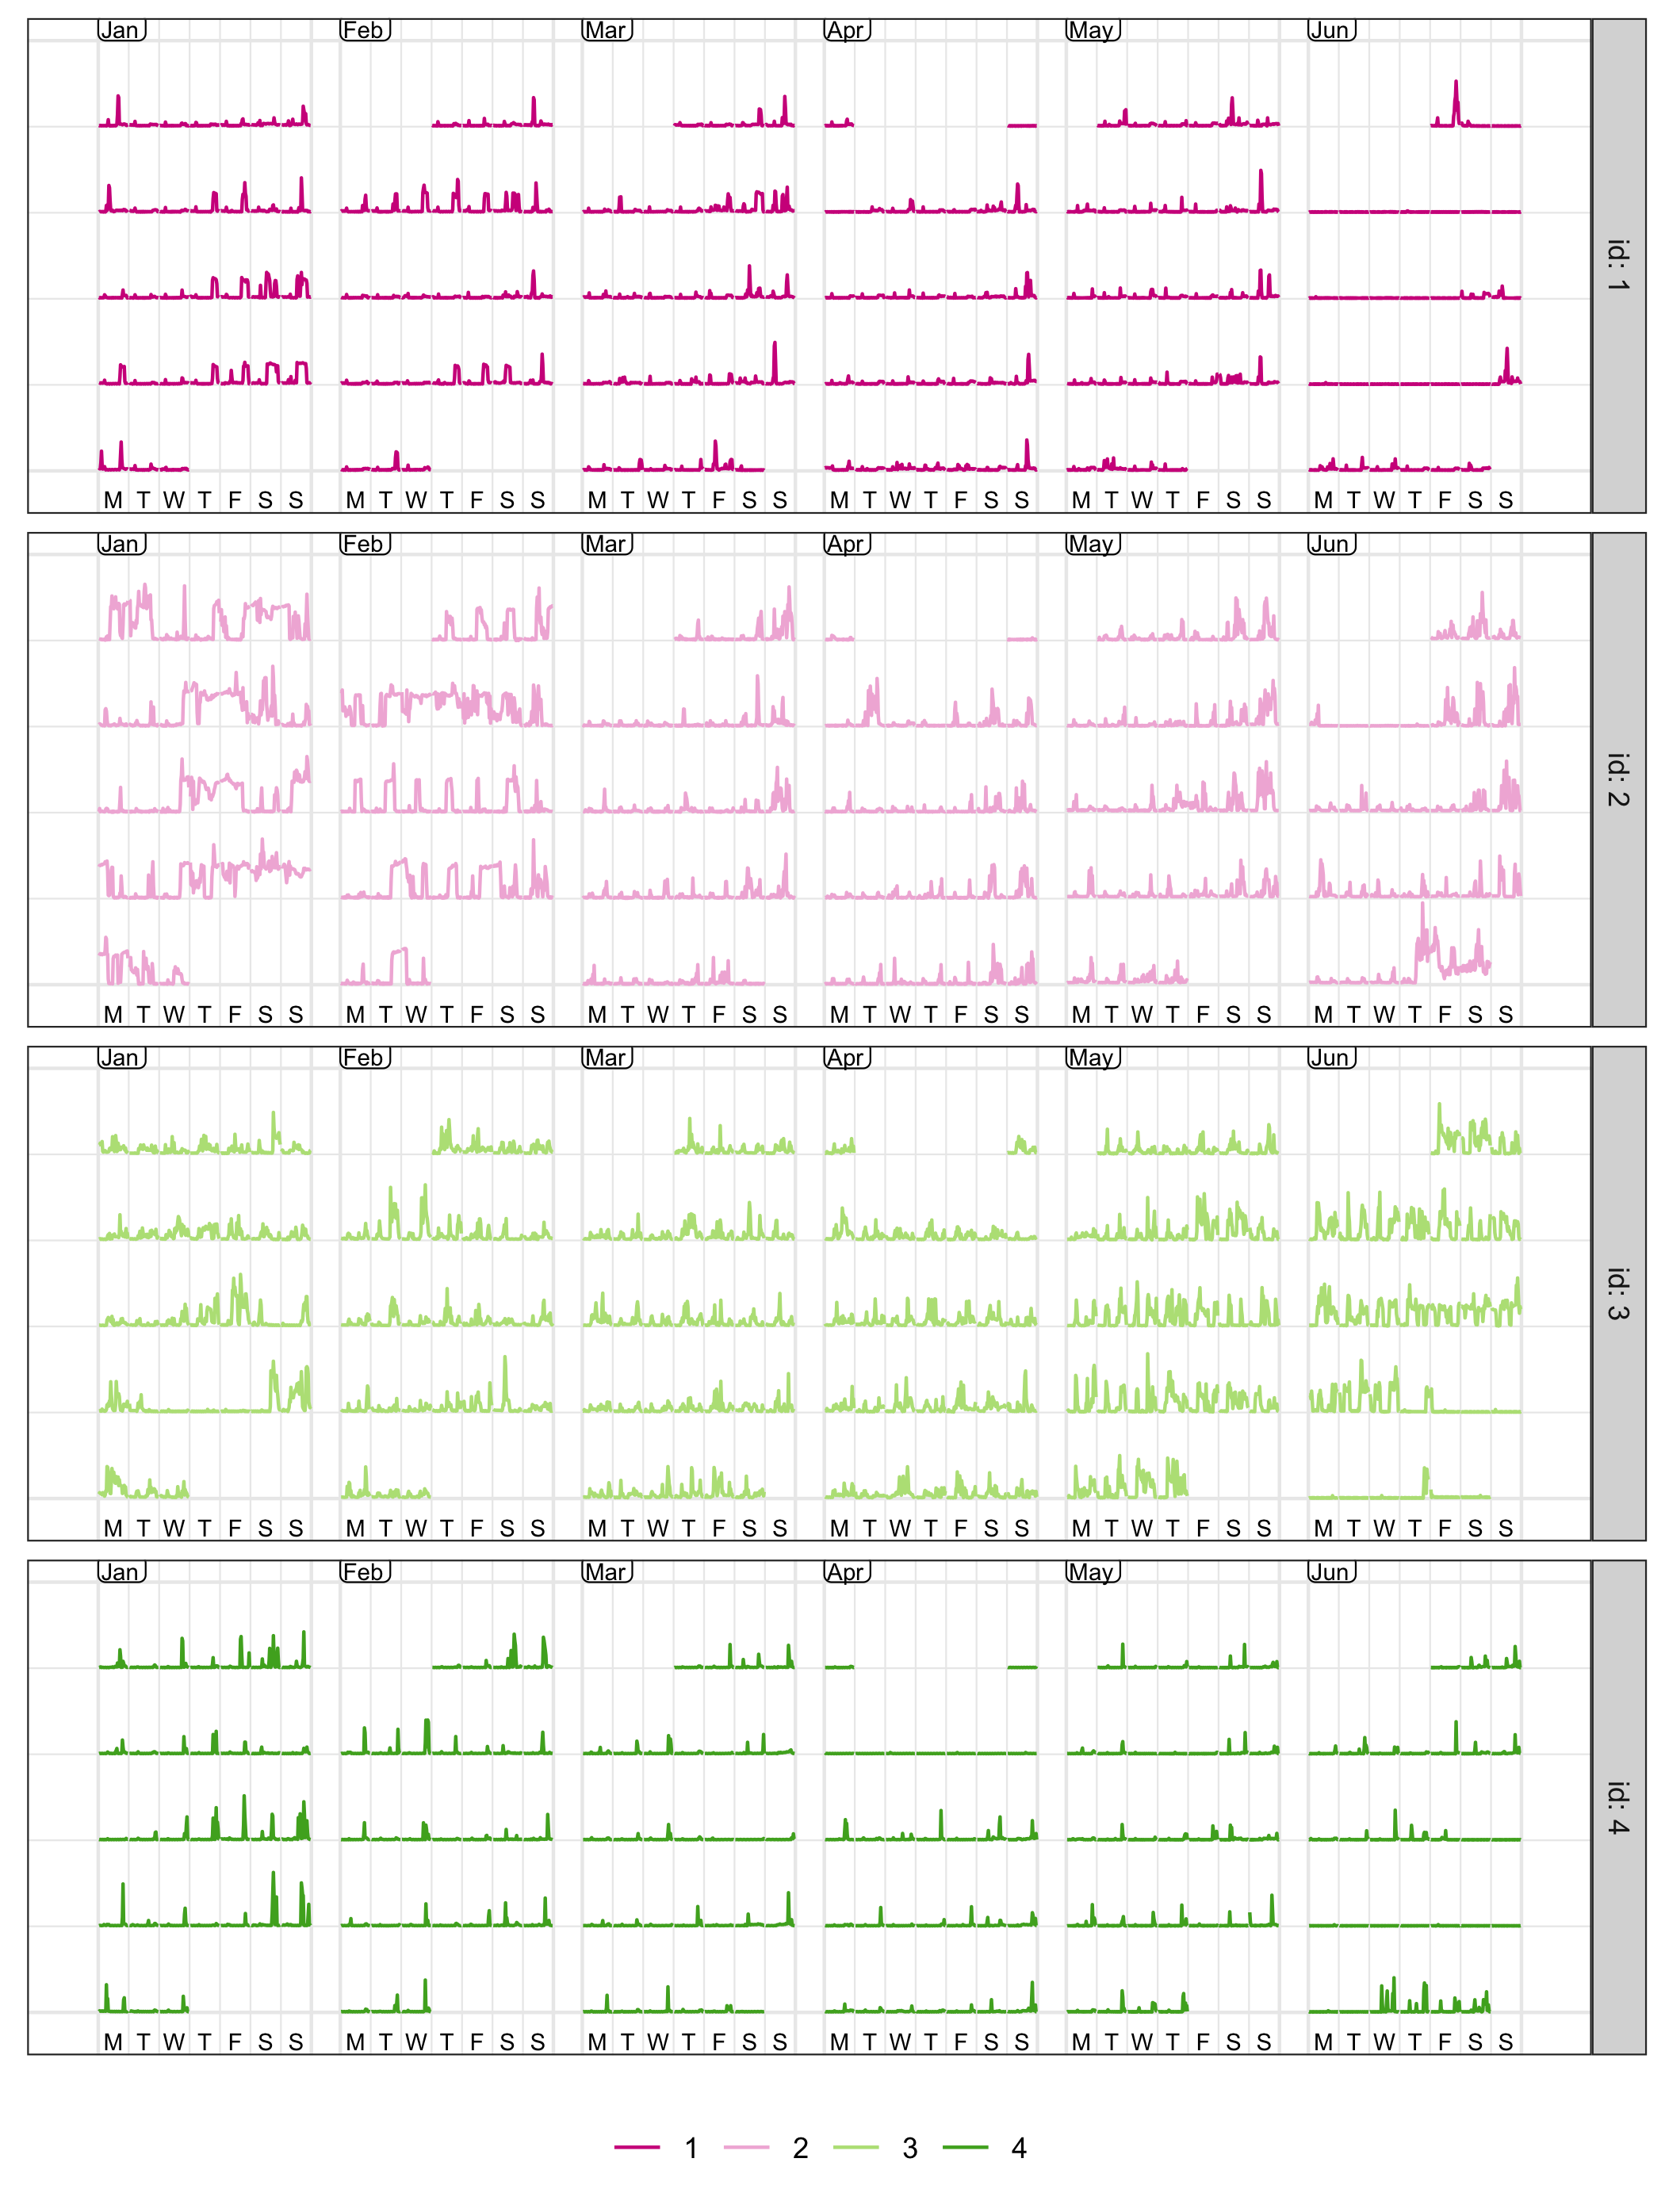
Figure 2.12: Calendar displays faceted by each household using global scales. Long flat low energy usage indicates vacation time, and high energy consumption by household 2 is visible in January and February. Note that April 30 is wrapped to the start of the month.
Figure 2.12 displays the global scaling of each household’s data in a calendar layout, unfolding their day-to-day life via electricity usage. Glancing over household 1, their overall energy use is relatively low. Their weekday energy use is distinguishable from their weekends, indicating a working household. The air conditioner appears to be used in the summer months (January and February) for a couple of hours in the evening and weekends. In contrast, household 2 keeps a cooling system functioning for much longer hours, which becomes more evident from late Wednesday through Thursday to early Friday in mid-January. These observations help to explain the stripes and clusters of household 2 in Figure 2.11. It is difficult to give a succinct description of household 3 since everyday energy pattern is variable, but May and June see more structure than the previous months. Individual data can be idiosyncratic, hence aggregated plots like Figure 2.11 are essential for assembling pieces to form a picture. However, the calendar plots tell the stories that are untold by previous plots, for example, their vacation time. Household 1 is on vacation over three weeks of mid-June, and household 2 also took some days off in the second week of June. Further, household 3 takes one short trip in January and another one starting in the fourth week of June. Household 4 is away over two or three weeks in early April and late June. They all tend to take breaks during June probably due to the fact that the University winter break starts in June.